Land ho!

We spotted land today! It’s the first land we’ve seen since setting sail from Rhode Island in April.  This brings us to the end of the expedition.  We did our last cast and ran the last few stragglers of samples last night.  Well, it was night according to the time, but we are so far north that it stays light for a long time.  In fact, it’s currently 10:30pm and it’s still bright out (we’re 4 hours ahead of EST)!


Iceland!

Iceland!


Today was spent packing up all the labs, which is a long, arduous process.  We needed to be extremely organized – every box is labeled so that Princeton’s equipment is easily identifiable.  The Endeavor has another expedition onboard after we leave and before the ship arrives in Rhode Island, so we have to know what belongs to us.  While we were packing, each box was also meticulously inventoried; thus, when the boxes do make their way back to New Jersey, the scientists will know what’s in each one when they need to find something.

Once all of our boxes were neatly packed, labeled, and inventoried, the hard part began – storing all of our stuff.  There’s limited space on the ship and everything really needs to be tightly tied down, especially the containers with glassware and chemicals (some chemicals can’t be disposed of safely at sea so they need to be brought back to Princeton for proper disposal).

We should arrive in Iceland around 9:00 am tomorrow morning (5:00 am EST) and we will spend one more day on the ship while docked in order to make sure that the labs and our cabins are cleaned and organized, as well as to store the remaining equipment.

My blogging journey with you, my faithful readers, has come to an end (at least for now!).

I will leave you with a photo of the entire (slightly windblown) science party:


The Science Party (left to right: Dr. Bess Ward, Andrew Babbin, Aimée Babbin, Jessica Lueders-Dumont, Dr. Sarah Fawcett, Jeff Hoffman, Dr. Nicolas Van Oostende, Keiran Swart, Qixing Ji).  photo courtesy of Q. Ji

The Science Party (left to right: Dr. Bess Ward, Andrew Babbin, Aimée Babbin, Jessica Lueders-Dumont, Dr. Sarah Fawcett, Jeff Hoffman, Dr. Nicolas Van Oostende, Keiran Swart, Qixing Ji). photo courtesy of Q. Ji


Until next time,

Ms. B

Spotlight Series: Keiran Swart

“Spotlight Series” is a group of posts designed to introduce you to the other members of the science party on the research expedition.

Keiran Swart

Keiran Swart on the deck of the Endeavor.  He is cleaning his net following one of the tows (how he collects organisms).

Keiran Swart on the deck of the Endeavor. He is cleaning his net following one of the tows (how he collects organisms).

Keiran Swart was born and raised in Miami.

Educational background: My undergraduate degree is from the University of Miami, where I studied geosciences, and my program had an emphasis on carbonate geology and sedimentology (for example, reef systems).  I am currently a graduate student in geosciences at Princeton.


How did you become interested in science?  A youth of Carl Sagan.  Actually, my parents are both geologists – my dad is also a geochemist, like me, my mom is more of a classical geologist, core-work and the like.  I grew up in it and always assumed I’d be a scientist.


Research Interests:

My main research interest is foraminifera – small (200µm) Protista that exist everywhere in the ocean.  They are like little microcosms of coral reefs because they host symbiotic life.  They are also calcareous – they contain calcium carbonate in their shells and have been a focus of geochemical study for over fifty years.  The oxygen isotopic ratio in their shells has been used to make judgments about atmospheric conditions, from temperature changes and other properties, a relationship discovered by Cesare Emiliani (incidentally, he’s also from Miami).

Foraminifera serve as geochemical proxies because they are representative across the ocean, are abundant, and are continuous (meaning they are everywhere and always present).  We can’t directly measure what the Earth was like a long time ago, but we can look at foraminifera to give us an idea.   My work is looking at the reconstruction of the past environment with foraminifera.

With foraminifera, there’s almost an endless amount of stuff you can do with it.  For example, inside a fossil, all that’s left is the shell, but the shell isn’t just calcium carbonate – it’s built on a web of protein that is an almost inconsequential component of the total mass (less than a percent).  Looking at this tiny organic component can help determine many different things such as degree of nutrient consumption or water mass movement.  My group tries to unify different parts of the field, including  modeling and studying modern analogs, to look at how the foraminifera population tracks environmental changes on a glacial interglacial timescales.


Research aboard the R/V Endeavor:

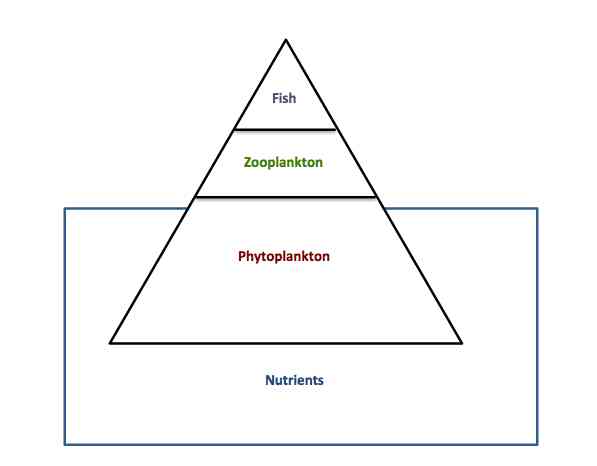
I want to look at the carbon isotopic composition of foraminifera, which is partly based on the trophic enrichment of isotopes (essentially, you are what you eat),  Original photoautotrophic bacteria create new organic matter (carbon) that represents the conditions the bacteria come from and the nutrients available – for nitrogen, this means nitrate or ammonium, and for carbon, carbon dioxide or bicarbonate.  The photoautotrophs are the bottom of the food web.  They are eaten by something else, which undergoes metabolism and excretes waste (this goes on all the way up the food web).  As we go up the food web though, the lighter isotopes (14N and 12C) tend to be excreted more than the heavier ones (15N and 13C).

I’m interested in what controls this variability. To analyze, I pick out the species of interest, then incinerate them to produce carbon dioxide and nitrogen gases.  The gases are then put through a GC (gas chromatograph – this separates the gases) and a mass spec to look at the mass profiles.  From these, I can look at both the carbon and nitrogen isotope ratios and correlate with different environmental permutations.

 I am interested in the isotopic composition of foraminifera.  Because they are heterotrophs and eat everything, and have a symbiotic relationship with organisms that fix new carbon and trap it, there exist a complicated mesh of processes that affect the signal.  Therefore, I need to get a good grasp on how the carbon isotopic composition varies across the food web and from different environmental conditions (including temperature, CO2 content in water, and pH, among others).

Basically, I collect water samples for alkalinity and carbon testing, and filter for organic matter.  At the process stations, I do plankton and zooplankton tows to collect those organisms.

The phytoplankton and zooplankton get crushed up and combusted in silver foil, and then undergo a series of redox reactions to trap gases.  This allows me to get the isotopic composition of the gas and see how it varies.  In the future, I hope to incorporate species levels and distinctions as well.

With my water samples, I do titration alkalinity (add acid until there is a rapid pH change) and measure the change in carbon.  Carbon is very complex but, essentially, CO2 is in equilibrium with H2O in various forms: carbonic acid (H2CO3), bicarbonate (HCO3), or, carbonate (CO32–), and is constantly re-equilibrating.  To look at what is biologically accessible to the foraminifera, I record a bunch of different conditions, like those I mentioned earlier – temperature, pH, etc.


Plans for the future: I want to stay in academia, though I have given thought to doing work for a nuclear regulatory agency (enforcing test ban treaties works by measuring the decay of radioactive isotopes) or work for the and environmental NGO or Greenpeace, but I do think I want to end up in academic doing research.

Back to Ms. B:

Mr. Swart is extremely passionate about his research and I hope that came across in his responses – having a sincere passion for what you are studying is essential!

Until next time,

Ms. B.

Natural Abundance

In a previous post, I discussed isotopes and two types of data being collected that utilize isotope ratios – uptake tracer experiments and natural abundance.  I spoke at length about uptake tracer experiments (to refresh your memory, N-15 labeled ammonium and nitrate are injected into seawater samples, left to incubate for a specific amount of time, and then analyzed by a mass spec to determine the mass profile of the phytoplankton – giving us a rate of nutrient uptake into the phytoplankton’s biomass).  Today’s post is dedicated to natural abundance nitrogen isotope ratios, which looks at the naturally-occurring isotope ratios in the ocean.

To understand natural abundance, it is first essential to understand how different isotopes react.  The majority of the processes I’ve discussed over the past three weeks are enzyme-mediated.  Enzymes are biologic catalysts and lower the energy needed for a reaction to occur, so the substrate (what a reactant is called when enzymes are used) binds to an enzyme and then the reaction occurs to give a product.  The graphic below was designed by my brother and depicts the marine nitrogen cycle, including the conversions among all of the different compounds, the enzymes involved (written in italics) and the fractionation factors (the numbers, discussed below) associated with each.


The marine nitrogen cycle. (courtesy of Andrew Babbin)

The marine nitrogen cycle. (courtesy of Andrew Babbin)


For natural abundance nitrogen, nitrogen compounds (nitrate and ammonium, for example) act as the substrates.  The reactions will occur with both N-14 and N-15 isotopes, but at different rates.  The lighter isotope tends to react faster, though the difference is very small.  Lighter compounds reacting/moving faster is actually a common theme in chemistry.  In gases, for example, lighter gases diffuse (spread) faster while heavier gases diffuse more slowly.  This is why helium balloons deflate more quickly than ones blown up manually – the smaller, lighter helium moves around more quickly and is more easily able to escape the balloon due its mass and size.

Back to natural abundance – the difference in reaction rates of different isotopes is called isotope fractionation and determines the 15N/14N isotope ratio.  We use this isotope fractionation as an identification agent (almost like a signature) for different processes because the different fractionations that occur result in different characteristic isotope ratios for each process and each nitrogen compound.

Nitrate is actually heavier on average than ammonium, meaning that nitrate has more 15N relative to 14N than ammonium.  This is because of additional fractionation of nitrate when it reacts in a process called denitrification. In denitrification, bacteria take nitrate and produce nitrogen gas (N2) that escapes and is lost to the system.  Because, as I previously mentioned, the 14NO3 will react faster than the 15NO3, more 15NO3 is left over.

Nitrate and ammonium are used by phytoplankton to build biomass, and make organic N.  Ammonium concentrations tend to be too low to determine a reliable natural abundance isotope ratio.  To measure natural abundance nitrate and organic N in phytoplankton, the isotopes are measured via mass spectrometry. To do this, these compounds are converted to nitrous oxide (N2O, which is a much smaller component of the atmosphere) using a “Denitrifier Method” (Sigman, et al. 2001).


A simple diagram showing how organic nitrogen is first converted into nitrate, followed by Dr. Sigman's denitrifier method.  The first part is a chemical reaction (I haven't balanced it)  whereas the second relies on biologically-mediated processes.  All the organic N is converted to nitrous oxide (that's why all the N's are blue!)

A simple diagram showing how organic nitrogen is first converted into nitrate, followed by Dr. Sigman’s denitrifier method. The first part is a chemical reaction (I haven’t balanced it) whereas the second relies on biologically-mediated processes. All the organic N is converted to nitrous oxide (that’s why all the N’s are blue!)


Organic nitrogen is first reacted with persulfate in a chemically-mediated process to make nitrate.  This nitrate is then used by bacteria to make N2O in a biologically-mediated process (this is Dr. Sigman’s denitrifier method).  The N2O is analyzed by mass spec to determine the isotope ratio.  The nitrogen passes from the organic nitrogen (from phytoplankton) to nitrate to nitrous oxide so the only nitrogen masses measured are those from the phytoplankton – nothing else is introduced into the reaction.

Studying natural abundance is important, as Dr. Fawcett mentioned in her spotlight, because knowing whether phytoplankton consume ammonium or nitrate helps determine their effect on the carbon cycle and climate.  Nitrate is a net remover of atmospheric carbon dioxide while ammonium has no net effect on CO2.

Until next time,

Ms. B

On a quick personal note, I want to wish my dad a very happy birthday! Miss you and love you! XO

Spotlight Series: Qixing Ji

“Spotlight Series” is a group of posts designed to introduce you to the other members of the science team on the research expedition.  Each scientist and his/her research will be featured – I provided the prompts and the scientists added their own information (my comments will be in brackets: [ ]).

Qixing Ji

Qixing Ji

Qixing Ji

Qixing Ji is from Shenzhen, China, a high-tech city of 14 million people and home to one of China’s two stock exchanges.  He recently received his Masters degree and is working on his PhD from Princeton University.

How did you become interested in science? I like solving problems and get a lot of satisfaction from solving a problem.  Science is all about discovering a problem and solving it.  Princeton is a great place to study science and Dr. Ward is an excellent advisor.


Educational background:  My undergraduate degree is in environment engineering from Zhe Jiang University.  I am currently completing my PhD in geosciences at Princeton.


Research interests:  Broadly, my general interest is chemical oceanography – chemical reactions related to biology in the ocean.  Specifically, my interest is in biogeochemistry.  I like chemistry because it’s an amazing subject.  It has a good combination of concepts, observations/experiments, and math.

I mainly study nitrous oxide, N2O, (laughing gas) and its distribution and biological production by bacteria and archaea in the ocean.  Nitrous oxide is an extremely important gas for the climate.  N2O is a greenhouse gas so it traps heat in the atmosphere by absorbing infrared radiation.  It’s actually 300x more powerful than carbon dioxide, meaning for the same mass of each gas, N2O will trap 300x more heat than CO2.

N2O also depletes ozone (which, among other things, protects us from skin cancer) and is currently the most important depletion agent, not CFCs (chlorofluorocarbons).

Human activity has produced more N2O the atmosphere and we need to figure out what processes contribute to this and why.  By studying the amount of naturally-produced N2O by the ocean’s bacteria, we can find the background concentration.  This allows us to then determine how much of the atmospheric N2O comes from humans.

Phytoplankton (magnified).  These are the organisms being studied by Qixing Ji and the other scientists aboard the Endeavor. (photo courtesy of Q. Ji)

Phytoplankton (magnified). These are the organisms being studied by Qixing Ji and the other scientists aboard the Endeavor. (photo courtesy of Q. Ji)

Research aboard the R/V Endeavor: I perform two experiments: the first looks at nitrous oxide concentration and isotopes, and for the second, I do incubation experiments.

For nitrous oxide concentration and isotopes, I look at the natural abundance of both nitrogen isotopes (14Nand 15N) and oxygen isotopes (16O and 18O).  N2O in the ocean exists in an equilibrium with atmospheric N2O.  This is important because biological activities and processes that produce N2O (for example, nitrification) or utilize N2O (ex. denitrification) alter the 15N2O / 14N2O ratio compared to the atmosphere.

In my incubation experiments, I am looking at how organisms produce N2O and the mechanisms by which this occurs.  To do this, I add labeled nitrogen isotopes to ammonium and nitrite [labeled isotopes are 15N], which causes the ammonium and nitrite to become 15NH4+ and 15NO2.  I then introduce these labeled compounds one-at-a-time to my seawater samples and leave them in incubators for 12-24 hours so the organisms can continue to increase their biomass (so 12-24 hours after adding labeled ammonium, I take samples then add the labeled nitrite).  Once that is complete, I will look at the composition of the N2O they have produced – if I added 15NH4+ and there is 15N2O, then ammonium is a source compound.  If the 15N2O came from labeled nitrite (15NO2) then nitrite is a source compound.

Plans for the future: My current goal is to complete my PhD!  Eventually, I think I would like to stay in academia and be a professor.  It’s a very respectful profession and academia is a great environment for scientists.


Back to Ms. B:

Climate change is one of the most serious problems the world is currently facing and has an enormous impact on the environment.  Researchers like Mr. Ji are essential to understanding how humans are impacting climate so we can figure out how to minimize that impact.

Until next time,

Ms. B.

Ammonium

By now, you’ve learned about nitrate and nitrite, two of the three nutrients I am helping my brother to analyze.  The third nutrient is ammonium (NH4+) and we are studying the rates of ammonium consumption via phytoplankton and through the process of nitrification.

Phytoplankton use ammonium as a nitrogen source to build biomass, and it is then released by zooplankton as waste after grazing on the phytoplankton.  Thus, the common thought is that it has a fast turnover.  We’re seeing large concentrations of ammonium in surface waters indicating that it’s being released more rapidly than it’s being consumed.  Nitrification is a biologically-mediated process by which ammonium is converted to nitrite and then to nitrate through a series of oxidation reactions.  Our Chief Scientist, Dr. Bess Ward, is a pre-eminent scholar of nitrification and will tell you all about it during her Spotlight Series interview (so stay tuned!)

We are determining the ammonium concentration of each seawater sample using a fluorometer, which measures the fluorescence of each sample. Fluorescence is a property in which a substance absorbs a shorter wavelength of light and emits a longer wavelength. The fluorometer shines ultraviolet (UV) light through the sample, which then fluoresces, and the fluorometer measures how much light is emitted by the sample.  As with the nitrate and nitrite analyses, we first create a standard curve (we measure the fluorescence of known concentration standards) then test the samples to find their concentration.


Fluorometer.  The sample is placed under the lid, then the amount of light fluoresced is displayed on the screen.

Fluorometer. The sample is placed under the lid, then the amount of light fluoresced is displayed on the screen.


Ammonium, itself, does not fluoresce so we first need to react it to create a new compound that will fluoresce.  To do this, the ammonium samples are reacted with a solution of OPA (o-phthaldialdehyde, an organic compound) and sulfite (SO32–), according to the reaction below.


The reaction of ammonia with OPA and sulfite.  The product isoindole is fluorescent.

The reaction of ammonia with OPA and sulfite. The product isoindole is fluorescent.


When these compounds react with ammonia (NH3), they form a fluorescent compound called isoindole – it is this compound that we directly measure with the fluorometer.  This reaction is not instantaneous; we let the reaction occur for at least three hours before we start measuring.

So why does this reaction happen with ammonia and not ammonium? Remember that, in a solution, equilibrium exists between ammonium (NH4+) and ammonia (NH3) and their concentrations are dependent on each other and the pH (pH is a measurement of the acidity or alkalinity of a solution, pH<7 is acidic, pH>7 is basic, and pH=7 is completely neutral).


The equilibrium between ammonium and ammonia.

The equilibrium between ammonium and ammonia.


Seawater has a pH of 8.2 (pure water has a pH of 7, for reference) so the ammonium concentration is more dominant than that of ammonia (ammonia takes over at a pH greater than 9.3).  However, there is still some ammonia in the seawater that we’re sampling.  As that is reacted with the OPA and sulfite (and is removed from the equilibrium, equation with ammonium), the concentration of ammonia decreases.  This decrease in ammonia concentration causes a stress to the ammonium-ammonia equilibrium, and that stress must be corrected according to LeChatelier’s Principle (which states that a system at equilibrium will shift to remove an applied stress).  The equilibrium shifts to create more ammonia, which is subsequently reacted with the OPA and sulfite.  Thus, the concentration of ammonium will determine how much ammonia can react with the OPA and sulfite, which are always in excess.

So now you know how Andrew and I measure each of the three nutrients we are studying!   The chemistry behind each is so interesting and uses a variety of concepts my students have been studying this year.  We are currently traveling to the second Process Station where we will have another few days of around-the-clock casts, sampling, and analyses.  We’re in the homestretch!

Until next time,

Ms. B


Spotlight Series: Jessica Lueders-Dumont

Continuing with the Spotlight Series of posts to introduce you to the other members of the science party:

Jessica Lueders-Dumont

Jessica Leuders-Dumont on deck with the incubators for her experiments.

Jessica Leuders-Dumont on deck with the incubators for her experiments. (photo courtesy of Jeff Hoffman)

Jessica Lueders-Dumont is currently a graduate student at Princeton University. Onboard the R/V Endeavor, she is mainly working with Dr. Van Oostende. [she also happens to be my roommate!]

What is your field of study? I currently study biogeochemistry and am interested in large-scale chemical cycling in the ocean.  I’m particularly interested in what controls food webs.  Think of food webs like a food pyramid (see below).

This pyramid represents a schematic food web.  The amounts and types of nutrients (for example, nitrate or ammonium) determine the amount and types of phytoplankton.  When phytoplankton die (linked to top-down control when the zooplankton eat the phytoplankton), they are recycled back into the nutrient supply. 

This pyramid represents a schematic food web. The amounts and types of nutrients (for example, nitrate or ammonium) determine the amount and types of phytoplankton. When phytoplankton die (linked to top-down control when the zooplankton eat the phytoplankton), they are recycled back into the nutrient supply.

There are two theories regarding the control of food webs: a bottom-up scheme and a top-down scheme.  In bottom-up control, the bottom of the pyramid controls the level above it.  So, the types and amounts of nutrients determine the amount of phytoplankton, which controls the zooplankton population, which in turn controls the fish population.  Top-down control is the opposite: predation (predators eating prey) control everything below.  In the ocean, both of these controls exist in a balance (not necessarily equal).  For phytoplankton blooms to occur, bottom-up control must be favored, but eventually this bloom decreases due to top-down control.

I think of biogeochemistry as the main control of food webs so understanding chemical cycles helps understand food webs.

Right now, I still feel like I’m in training and learning how biogeochemistry controls the types of phytoplankton that grow based on the types of nitrogen available.  This then controls the type and amount of zooplankton, and so on up the web.

Oceanography actually started due to fisheries and why there are differences in the amounts of fish that are available each year (essentially, why do fish populations vary year to year). This ties into my background interest in fisheries related to the fact that many fish populations are declining and maintaining fish populations are very important.


How did you become interested in science?  Science is fun.  You get to ask questions, do experiments, need to think creatively, and get to travel to cool places.  I grew up in Vermont, then went to college in Maine and worked at a marine research institute.  Following college, I moved to Idaho and worked as a technician studying river chemistry and fish.  I’ve worked in Maine studying phytoplankton and Washington, DC to study fisheries policy.  I’ve also lived, worked, and studied in Iceland, Alaska, Massachusetts, and now New Jersey.


Educational background: My undergraduate degree is from Colby College in biology with minors in studio art and STS (Science, Technology, and Society – history and ethics of science).  I’m currently in the second year of my PhD program in geosciences at Princeton.


Plans for the future:  Definitely research, not sure in what capacity, but hopefully I can study both phytoplankton and fish.  My current long-term goal is academia.


Until next time,

Ms. B.

Spotlight Series: Dr. Nicolas Van Oostende

“Spotlight Series” is a group of posts designed to introduce you to the other members of the science team on the research expedition.  Each scientist and his/her research will be featured – I provided the prompts and the scientists added their own information (my comments will be in brackets: [ ]).  Feel free to ask questions about what they are studying and how they became interested in science!

Dr. Nicolas Van Oostende

Dr. Van Oostende aboard the R/V Endeavor

Dr. Van Oostende aboard the R/V Endeavor

Dr. Van Oostende is from Ghent, Belgium and is a post-doctoral researcher at Princeton.

What is your field of study? I consider myself a microbiological oceanographer.  My field is a subset of biological oceanography but specifically focuses on microscopic organisms (the main biomass of the ocean) and their distribution.

What research are you studying on the Endeavor? I study the community structure of phytoplankton, or the relative abundance of the components in the ecological community.  Using flow cytometry [this was discussed yesterday in the McLane Pump post], I divide microorganisms by various properties – size and pigment composition are two examples.

In relation to biogeochemistry (the chemical cycles), I look at the interaction between microorganisms’ identity and function (e.g. do they produce biominerals, are they large or small, slow or fast-growing), and how that relates to what they’re doing in the ocean.

I am performing various analyses during the expedition – primary production measurements using flow cytometry to characterize the community, and nutrient  and carbon isotope uptake experiments to quantify rates of activity.


Previously, I studied carbon isotopes to look at calcification (like the remains of algae that created the cliffs of Dover).

The cliffs of Dover (photo from Wikipedia).  The white is essentially the skeletons of dead algae over thousands of years.

The cliffs of Dover (photo from Wikipedia). The white is essentially the skeletons of dead algae over thousands of years.


How did you become interested in science? I have always been interested in science.  I always did experiments when I was little and I liked blowing stuff up.  My grandmother gave me a chemistry kit when I was younger.  I find biology the most interesting of the sciences because it is much more diverse and alive than the others.

Plans for the future:  I am not sure I want to stay in academia [college-level education], and am considering a job in the private sector.  I would like something in which I can utilize my microbiology and biological modeling skills in a research-based environment.

 Educational background: My education has been at Ghent University.  I was in an international program and collaborated with other scientists in Germany, Holland, France.  The educational system is different than in the United States – a bachelors degree takes two years, then another three years for a masters degree.  Once that is complete, you can begin your doctoral work for three-four years.

I had a difficult time choosing what I wanted to study.  I very much like plants, but zoology [in a nutshell, the study of animals] was more fun.  I did my masters thesis on pollination of bees using artificial flowers.

Back to Ms. B:

There are so many scientific fields and exciting topics to research – a career in the sciences is full of possibilities!

Until next time,

Ms. B.

McLane Pumps

Hello my readers! I apologize for not posting yesterday, but, to be honest, I was exhausted and fell asleep before I had a chance to write anything. Yesterday was just an extremely busy day – a ton of samples were collected and the nutrient analyses run.

We did have an excellent surprise though – a group of pilot whales decided to hang out and swim alongside the ship for a while! They were beautiful.


Pilot whales swimming alongside the Endeavor (photo courtesy of Jimmy Ji)

Pilot whales swimming alongside the Endeavor (photo courtesy of Jimmy Ji)


Today was our third day at the Process Station. As I mentioned previously, we are spending time here because we want to study the biological processes occurring in this part of the ocean more thoroughly. One of the ways we do that is with McLane pumps.

These pumps allow for large volume filtration (around 300L) in situ, meaning that seawater gets pumped through while the pump is still in the ocean, concentrating lots of particles onto the filter for analysis. So, instead of collecting water then filtering (like I explained in the spotlight on Dr. Fawcett), she can collect much more suspended particles directly from the ocean.


Recovery of the McLane Pumps (photo courtesy of Jimmy Ji)

Recovery of the McLane Pumps (photo courtesy of Jimmy Ji)


The McLane pump is truly an interesting piece of electrical equipment. It’s controlled by a computer, and the researchers can program the McLane what time to start and stop and the flow rate at which to pump (how fast the water moves through the filters). The McLane also records data (flow rate, depth, etc.) that can be accessed when next connected to the computer. Timing is very important, as we need to ensure that the pump is at the right depth before it starts pumping. We usually deploy the pumps about an hour before they are scheduled to being their work.

McLane Pump

At the upper left is a round black casing – this houses the filters and is where the water flows into the machine. The actual pump is the smaller silver cylinder in the center of the machine; this is what allows for the movement of water. The large, brownish-gray cylinder at the bottom contains the electronics and batteries that control the machine and transmit information to a computer. Water flows out of the pump at the bottom right – through a flow meter and out the white spigot.   We have two pumps on board and they are both deployed simultaneously, but go to different depths. The housing for the pumps (the metal case surrounding the whole thing) has notches and a clamp that secure it to a very strong line so they can be safely and securely deployed to whatever depth we want to study.

The pump can hold up to three filters, depending on what is going to be studied and the filters’ various sizes (i.e. 100µm, 5µm, 0.4µm, etc.) allow us to collect different particles/organisms. Filter size refers to space between the pores – larger spaces capture larger particles (for example, phytoplankton) whereas smaller filters will collect smaller cells, like bacteria. Using multiple filters to collect particles of different sizes is called size fractionation – things on each filter are similar in size to each other. This is the first step in identifying the various particles that are present in the seawater.

Once the McLane pumps are recovered, the first step is to remove any excess water from the filters to ensure that particles are not lost when the filter is taken out of the pump. To do this, the filter and its casing are connected to a small vacuum pump that sucks out the water. Once this is complete, the filter is removed and then stored for further processing (often in the freezer until we return to Princeton).


The filter from one of the McLane pumps, following its time in the ocean.  The filter starts out white - all that greenish stuff is particulates to be studied.

The filter from one of the McLane pumps, following its time in the ocean. The filter starts out white – all that greenish stuff is particulates to be studied.

There are numerous analyses that can be performed from the filters – measurements of carbon and nitrogen content, isotope ratios (13C/12C and 15N/14N), DNA, natural abundance, and flow cytometry.


Researchers Dr. Sarah Fawcett (right) and doctoral candidate Jimmy Ji (left) prepare a McLane filter for further analysis back at Princeton

Researchers Dr. Sarah Fawcett (right) and doctoral candidate Jimmy Ji (left) prepare a McLane filter for further analysis back at Princeton


Flow cytometry is very cool. First, the filters, and therefore the cells, are fixed in formalin (a solution of formaldehyde in water) to retain their shape and structure. When the filters are put into a flow cytometry machine, the cells are essentially lined up, then cut with lasers. Based on how the cells scatter the light, the machine is able to determine size, complexity, and pigmentation of the cells. What this does is allow researchers to look at different populations based on their morphology (size and shape) and pigmentation.

We have another day at the Process Station, then we continue our journey – there’s only a week left of the expedition!

Until next time,

Ms. B

The Wonderful World of Water

Today was a beautiful day! The seas were calm, the skies were clear, and we started around-the clock analyses. OK, so that last one wasn’t really beautiful, but it does mean we have hita major milestone for the expedition. Today we arrived at our first process station, which is an area of the ocean we want to study more thoroughly. We’ll spend about four days at this location, collecting lots of samples and performing numerous tests and analyses.   For me, this means more time with my buddy, the NOx Box, and making a bunch of solutions and standards.

As I look around, all I see beyond the ship is water, the inspiration for today’s topic. Water is one of the most abundant molecules on Earth. The world ocean comprises 71% of the Earth’s surface area and is completely essential for life on our planet (this isn’t the total amount of water on Earth – there’s also ice and other smaller bodies of water).

If you’ve ever tasted seawater (intentionally or accidentally), the first thing you probably noticed is that it was salty. Unlike pure water (H2O only), seawater contains a lot of salt. This salinity, which is the concentration of all the chemicals in the ocean, gives seawater some different properties than freshwater. Two of these are density and freezing point. Density, as my students should remember, is the amount of mass per unit of volume (usually mL, L, or cm3). The density of all water depends on temperature and pressure. At 20°C, the density of water is about 1g/mL (1kg/L). When you decrease the temperature, the density also decreases. Think about a glass of ice water – are the ice cubes at the top or bottom of the glass? From experience, you know that ice floats. This is due to its density being less than that of the liquid it’s in – less dense will always float on top of a denser substance (this is actually a unique property of water; for most substances, the solid form is more dense than the liquid).

Seawater’s density, like that of fresh water, also depends on temperature and pressure but also on salinity. As the salinity of water increases, the density also increases. This partially explains why, at the sea’s surface, the density of water is about 1.027 kg/L. It also helps explain an interesting difference between pure water and seawater in their maximum densities. Pure water is at its densest at 4°C, whereas seawater is at its densest right before freezing.

Another difference between fresh water and seawater that’s caused by salt ions is the freezing point, the temperature at which a substance becomes solid. Water’s freezing point is normally 0°C (32°F), but seawater has a freezing point of -1.9°C (28.58°F). This decrease, called a freezing point depression, is one of the colligative properties (a property that depends on the ratio of solute molecules to solvent molecules) of all solutions – increasing the amount of dissolved solutes (in this case, salt ions) increases the molality of the solution, which changes the freezing point of the solution. Molality is the mass of solute (what is dissolved in a solution) per kilogram of solvent (what is doing the dissolving). In seawater, the solutes are the salt ions whereas the solvent is water.

 By mass, approximately 86% of the salt in seawater is NaCl. The other main ionic components are magnesium, calcium, potassium, and sulfate. Scientists have experimentally determined the molality of the each of the major ions in the ocean. From that, we can calculate the molar concentration of each salt component in the ocean.

Let’s do some math!

The molality of sodium ions in the ocean is 10.76 g/kg. What is the molarity (molar concentration) of sodium? Assume the density of seawater is 1.027 kg/L.

To solve this, we need to convert g/kg to mol/L – both of which are simple to do!

Step 1: Write down what you know

Solute = sodium

Solvent = water

Molality = 10.76 g/kg (this means 10.76 g Na+ / 1 kg water)

Density = 1.027 kg/L

Molar mass of sodium (from your Periodic Table!) = 23 g/mol


Step 2: Convert the mass of sodium to moles

10.76 g Na x (1 mol Na / 23 g Na) = 0.4678 mol Na+ 

Step 3: Convert mass of water to liters (use density!)

D= 1.027 kg/L

Mass = 1 kg (from the molality)

The equation for density is D = mass/volume, if we rearrange that to solve for volume, we get the equation V = mass/D

V = 1 kg / (1.027 kg/L) = 0.973 L

Step 4: Solve for Molarity!

M = mol/L

M = 0.4678 mol / 0.973 L = 0.481 M

This means that in every liter of water, there are 0.481 moles of sodium ions.

Now, I want you to calculate the molar concentration of chlorine: molality = 19.35 g/kg, molar mass of Cl = 35.45 g/mol, density = 1.027 kg/L. Just follow the same steps! (you should get 0.561 M Cl)

Until next time,

Ms. B.

On-Board Entertainment

Yesterday’s post was really heavy on the science, so I’m going to give all of my readers a bit of a break and talk again about life at sea. We’ve now been aboard the R/V Endeavor for two weeks – time is certainly flying! We are essentially sailing in the middle of nowhere and are together almost 24/7, working very hard to ensure our experiments are running smoothly and gathering data (to say nothing of the amazing crew, who work around the clock). It’s very easy to go a little stir crazy being in a confined space all the time, so in order to keep up morale and maintain our sanity, we formulate our own on-board entertainment. We do have a lot of movies and TV shows that we can watch, as well as a library with hundreds of books, but over the last couple days, we ramped up the amusements.

The first was a haiku contest (haikus are Japanese poems with seventeen syllables grouped in three lines: five syllables – seven syllables – five syllables) in which all the scientists and Erich, our Marine Tech (he keeps everything running for us) submitted poems anonymously. The haikus were then grouped into categories and judged by the First Mate, Shanna. To my surprise, I won for the most “HAI-gooeyest” haiku (i.e. the cheesiest). Here is my submission:

Gentle seas ahead
The NOx Box hums gleefully
Science is awesome

My Hai-gooeyest medal (made by Dr. Bess Ward, our Chief Scientist)

My Hai-gooeyest medal (made by Dr. Bess Ward, our Chief Scientist)

I am quite proud of it  ☺

This morning I awoke to another of the science party’s entertainments – a shrunken Styrofoam head (like the Styrofoam cups from a few days ago). I call her Frida, after Frida Kahlo, the Mexican painter.

Frida, the Shrunken Head

Frida, the Shrunken Head

When I went to get ice for the NOx Box, I opened the freezer and there, encased in ice, was a shrunken head staring back at me. It freaked me out…not quite what I expect to see at 3:45 in the morning! The rest of the science team had frozen her to surprise Andrew and he left it for me to see. Andrew and I are now in possession of Frida and have to figure out where (and for whom) to hide her. I can’t wait!

Finally, today is dedicated to our mothers. The science team and I wish all of our moms a very happy Mother’s Day. We love and miss you.

On a personal note, a very, very big thank you to my mom who is my staunchest ally, biggest supporter, and most trusted confidante – thank you for always believing in me and pushing me to be my best (I certainly wouldn’t be on this expedition without your support and encouragement). I love you! XO

Get ready for lots of science tomorrow!
Until next time,
Ms. B.